AI for Spreadsheets: Excel Reports Without a Single Formula
You describe the task in plain words, and the AI adds up the totals, writes the formulas, tidies the data, and builds the charts. I walk through real examples of how to put together a report in Excel or Google Sheets in ten minutes, without memorizing a single function. For everyone who sells services, courses, and consulting and is tired of wrestling with spreadsheets by hand.
To build reports in spreadsheets with AI, you do not need to know formulas. You paste the table into the chat or attach an Excel file, write the task in plain language – add up the total for each month, find the clients with the biggest orders, pull a summary by rep – and you get either a ready formula to drop into a cell or the calculated result. The most accurate helper for data is Claude: it accepts files and draws charts right in the window. ChatGPT does the same, and DeepSeek is a strong, low-cost option for crunching numbers. One report from raw data takes about ten minutes to build. The single iron rule is to double-check the final numbers, because AI sometimes counts wrong.
Someone sends you an eight-hundred-row sales export, and by tonight you need to know how much you made, which client brought in the most, and which month tanked. You open the spreadsheet, try to remember how VLOOKUP is written, dig through search results, copy someone else's formula, it throws a #REF error, you fix the separators, another error. An hour gone, no report, mood ruined.
All of that work can go to the AI instead. I run four client projects and a channel with 20,000 followers, I count revenue, dig through exports, and put together reports almost every day, and the AI has been writing my formulas for a long time now. Below I will show the whole path step by step: which AI to use for spreadsheets, how to feed it your data, how to get a formula and a finished summary, where it lies, and what to do about it.
It is an eighteen-minute read. And you will stop being afraid of spreadsheets – you will learn to get answers out of them instead of fighting formulas.
What's inside
- What running spreadsheets through AI actually means
- Which AI to use for spreadsheets
- Formulas without the pain: AI writes them for you
- A report from raw data in ten minutes
- Cleaning up: tidy and standardize your data
- Pivot tables and grouping without the struggle
- Charts: turn a table into a diagram
- A live breakdown: run the numbers in an hour
- Common mistakes and how to get around them
- What you should never upload to AI
- Checklist: your first report
- The whole path in a minute
Section 01What running spreadsheets through AI actually means
Let's settle the main idea so we speak the same language from here on. Spreadsheet work used to look like this: you hold dozens of functions in your head, you remember where a comma goes and where a semicolon goes, and you assemble a formula out of all that by hand. Miss one character and you get a red error instead of a number. That barrier is exactly where most people trip and decide spreadsheets are not for them.
With AI, the roles change. Now you are the client who explains what is needed, and the AI is the specialist who knows every function and every bit of syntax by heart. You say: add up revenue for each rep and show me who is on top. The AI translates that sentence into spreadsheet language and hands you the finished answer. Remembering the name of the right function is no longer your job.
You can work with spreadsheets through AI in three ways, and it helps to tell them apart from the start.
Way one – a formula on request
You describe what needs counting, and the AI hands back a ready formula. You copy it and paste it into a cell in your own spreadsheet. Excel or Google Sheets does the math; the AI simply wrote the text of the formula for you. This is handy when there is a lot of data and it keeps changing: the formula lives in the sheet and recalculates on its own the moment you edit any number.
Way two – analyzing your data
You give the AI the table itself – attach a file or paste the rows as text – and ask it to break things down: total it up, find patterns, pull a summary. Here the AI does the counting, not the spreadsheet, and returns a finished answer in words and numbers. Good for when you need to quickly understand what is going on in the data, without shuttling formulas back and forth.
Way three – a table from scratch
You do not have a table yet, but you need a structure: a client tracker, a content plan, a project budget, a payment log. You describe what you want to see, and the AI builds a ready table with columns, sample rows, and hints about what goes where. All that is left is to copy it into Excel or Google Sheets and fill it with your own data.
Next we will walk through each way in detail, with ready phrases to copy. But first, let's pick the AI itself – that decides what you can even do.

Section 02Which AI to use for spreadsheets
For numbers and data, AIs differ more than they do for plain text. One counts carefully and accepts files; another gets confused adding things up. Let's run through the options so you know what you are getting.
Claude – the most accurate with data
If you pick one tool for spreadsheets, I recommend Claude. It calmly accepts Excel and CSV files right in the chat, counts carefully, and – best of all – can draw charts and build mini-tables right in the window with its Artifacts mode. You attach an export, ask for a summary, and a finished chart or a clean table appears on the right side of the screen, ready to copy. For breaking down data, it is the strongest helper today. There is a free tier, and it is enough to try everything in this article; the site is claude.ai. If you are in a region where Claude is not available directly, you will need a VPN and an email that isn't tied to that region; I broke down getting set up and paying for Claude in a separate piece on how to pay for Claude.
ChatGPT – also strong, same idea
ChatGPT from OpenAI works with spreadsheets just as well: it takes files, counts, and builds charts. If you already use ChatGPT, you do not have to add Claude specifically for spreadsheets – it will handle the tasks in this article. If you can't decide between them, I compared the two in Claude vs ChatGPT.
A budget option – DeepSeek
When you want something cheap, DeepSeek is worth a look. It is especially strong at analytics and working with numbers, and through the API it is the cheapest of the bunch. For simple reports, formulas, and breaking down small exports, DeepSeek is plenty. The free tiers of Claude and ChatGPT also cover most of what you will do while you learn. A wider comparison of the tools worth using is in my roundup of the best AI tools of 2026.
Need serious analytics, big exports, and charts – go with Claude. Want to start right now for free – the free tier of Claude or ChatGPT covers your first reports. Watching the budget on heavy number work – DeepSeek. If you have no idea where to begin, I laid the choice out step by step in how to choose an AI tool.
Section 03Formulas without the pain: AI writes them for you
The most common pain in spreadsheets is formulas. VLOOKUP, SUMIF, joining text, pulling a date out of a cell. You never have to learn any of it again. Here is how it works, on a live example.
Imagine you have a table of deals: column A is the client name, column B is the rep, column C is the deal amount. You need to know how much each rep sold in total. Instead of dredging up the function, you write the AI a simple sentence.
I have a table in Excel. Column A is the client, column B is the rep,
column C is the deal amount. Data runs from row 2 to row 801.
Write a formula that totals all sales for the rep named Sarah.
Tell me which cell to paste it into.
In return, the AI gives you a ready formula and explains where to put it.
=SUMIF(B2:B801,"Sarah",C2:C801). It adds up every amount in column C where column B says Sarah. If your rep names live in a separate list, replace "Sarah" with a reference to the cell holding the name, and you can drag the formula down for everyone.
You copy the formula, paste it into cell E2, and Excel counts. You didn't have to remember the function name or the order of the arguments. If the formula throws an error, you just copy the error text back into the chat and write: it gives this error, fix it. The AI will figure out what's wrong – usually a separator or a bad range – and send back a corrected version.
Excel and Google Sheets – ask for the version for your app
Here is an important detail that trips up beginners. Excel and Google Sheets share most function names, but the argument separator can differ depending on your regional settings – some setups use commas, others semicolons – and a few functions behave differently between the two apps. Paste a formula built for the wrong setup and you get an error. So always say which app you are in.
I need this formula for Google Sheets, not Excel.
Rewrite it with the right function names and separators.
The AI hands back the version for the app you need, and it drops in without edits. It works in reverse too, when you are moving formulas out of someone else's file. And if you need formulas often, keep a couple of ready phrase templates on hand – I showed how to do that in the piece on how to write prompts.
Here are the requests that cover nine out of ten formula tasks. Swap in your own columns and numbers.
Total column C for every row where column B says Paid.
For each client in the first table, pull their city from the second table by matching the name.
Work out what percentage each row is of the column's total.
Pull just the month and year out of the date in column A so I can group by month.
To each request, add at the end: give the formula for Excel and tell me which cell to paste it into.
Notice you never named a function anywhere. You described the result you wanted, and the AI took on the job of translating it into spreadsheet language. That is exactly how the fear of formulas fades: you stop memorizing syntax and start simply setting the task.
Section 04A report from raw data in ten minutes
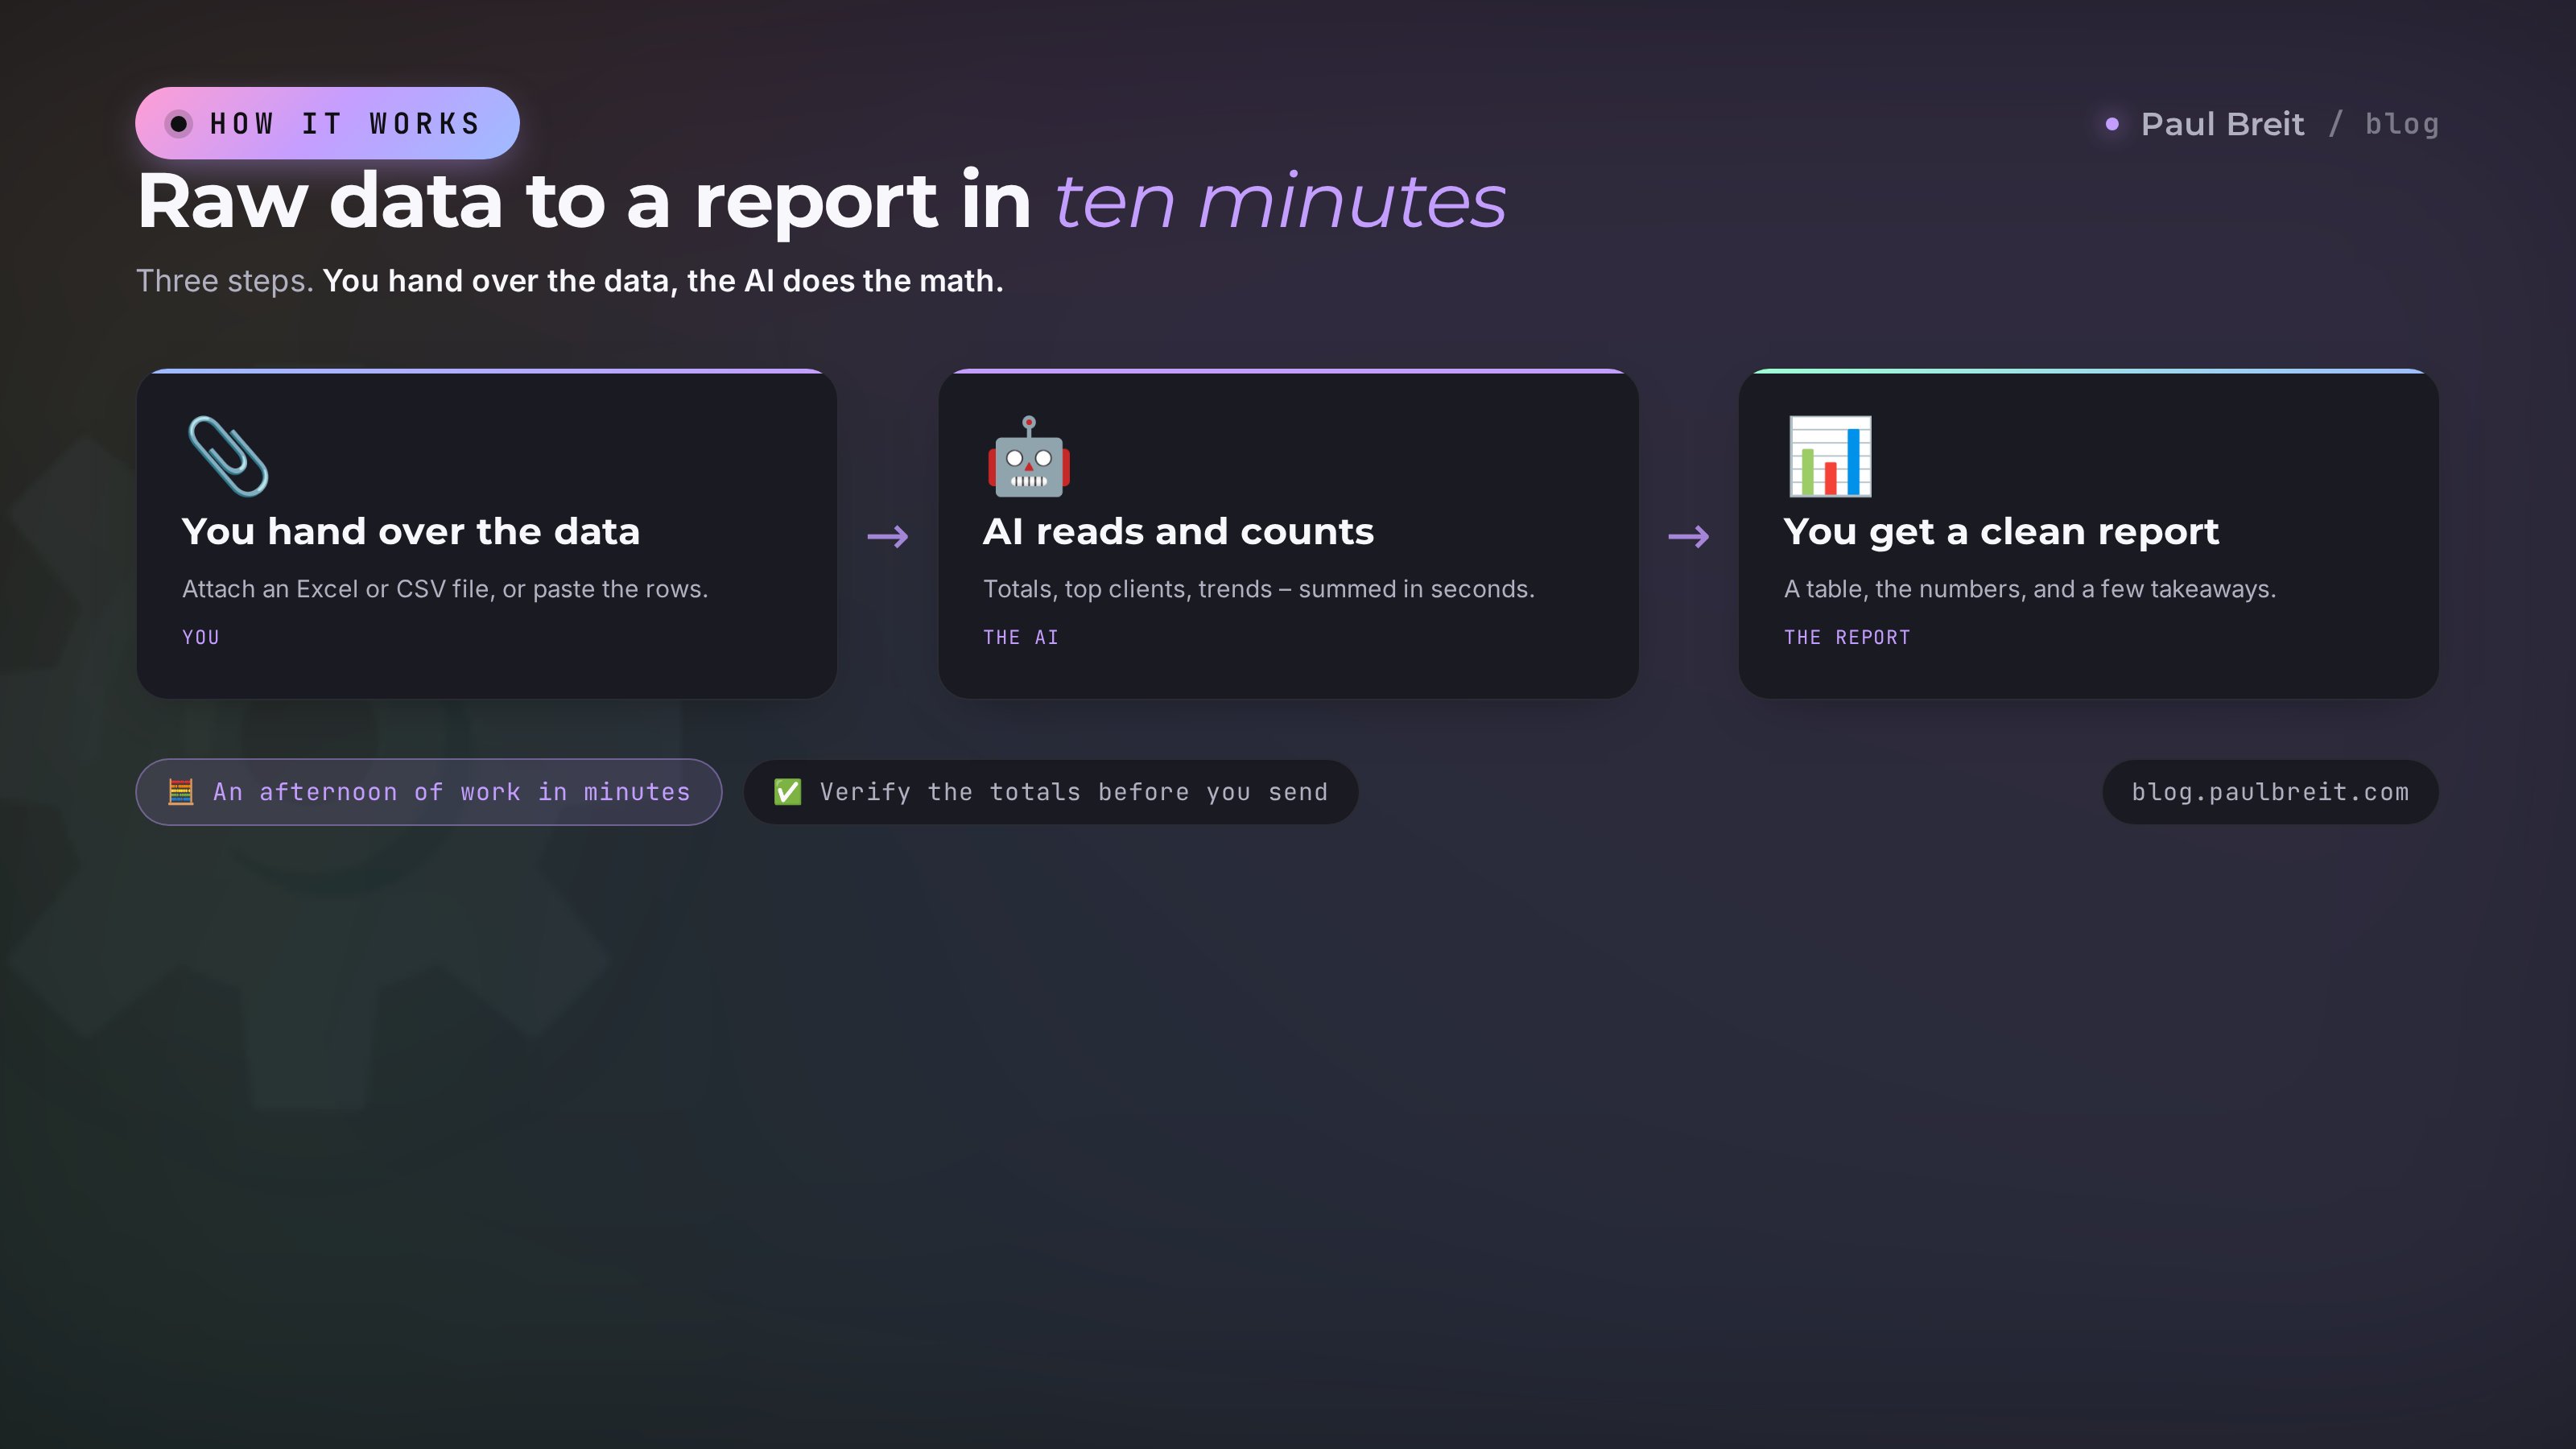
Now for the good part. Often one formula isn't enough – you need a whole report: take a raw export and turn it into a clear picture. This is where the second way works: hand the data to the AI and ask it to break things down.
First you have to get the data across. There are three routes; pick whichever is easiest.
Attach a file
Claude and ChatGPT accept Excel and CSV files. Drag the file into the chat window or click the paperclip. The AI sees every row and column. This is the most reliable route for big tables.
Paste the table as text
If the service doesn't take files, select the chunk of the table you need right in Excel or Google Sheets, copy it, and paste it into the chat. Rows and columns are preserved, and the AI reads it as a table. Good for smaller exports of a few hundred rows.
Export to CSV
In Google Sheets, open the File menu, then Download, and choose CSV. You get a plain text file of data that any AI understands. Almost every service with an export offers the same format – from payment processors to email tools.
Data delivered – now ask for the report. Frame the task as if you were explaining to an assistant what you want to see in the end.
Here is a quarter of sales data. Put together a short report:
1. Total revenue for the quarter.
2. Revenue by month and which month was best.
3. Top 5 clients by amount.
4. Average order value.
5. Two or three takeaways: what stands out in the data.
Answer with a table and a list, no fluff.
Within seconds the AI hands back a finished summary: the numbers, a table by month, a list of the biggest clients, and short observations like June being down a third while one client made up a fifth of all revenue. What would have taken an hour by hand with formulas and pivots, you get in a couple of minutes. All that's left is to double-check the key numbers – we'll come back to that in the mistakes section.
Section 05Cleaning up: tidy and standardize your data
Real exports are rarely clean. Names spelled different ways, stray spaces, dates in three formats, duplicate rows, a first and last name jammed into one cell. This used to take half a day by hand. The AI does it from a description.
Remove duplicates and clutter
You paste the table and write: find the repeated rows and show me which to delete, keeping one of each. The AI walks the data and returns a clean list. The same way, you can ask it to strip blank rows, trim spaces from the edges, or bring phone numbers to a single format.
Split or combine columns
A common task – one column holds both first and last name, and you need two separate ones. Or the reverse: you need to join them. The wording is simple.
Column A holds a full name in the format First Last.
Split it into two separate columns: first name, last name.
Return it as a table so I can paste it back into Excel.
If a formula is needed for that, give me that too, for Excel.
Bring things to one standard
When people typed cities however they liked – NYC, New York, N.Y., new york – the report treats those as different values, and the summary lies. Ask the AI to standardize the spelling: replace every variant of New York with one. It builds the right replacement, and on a big file it will suggest a formula to do it all at once.
Before any report, first ask the AI to check the data for junk: identical records with different spellings, empty cells, odd amounts like negatives or suspiciously large ones. Five minutes of cleanup saves an hour of figuring out why the numbers don't add up.
Section 06Pivot tables and grouping without the struggle
A pivot table is when you fold a big export down into a compact summary: sales by month, leads by source, spending by category. In Excel they're built through a separate tool that scares a lot of people. With AI there are two approaches, and both are simpler.
Approach one – the summary right in the answer
You hand over the data and ask it to group. For example: group spending by category and show the amount and the share each category is of the total. The AI returns a finished, folded table with totals and percentages. Copy it into your file and the summary is done, without a single click in an Excel menu.
Here is a table of this month's spending: a category column and an amount column.
Build a summary: for each category, the total amount and its share as a percentage
of all spending. Sort by amount, descending.
Add a Total row at the bottom.
Approach two – instructions for Excel
If the data changes and you want the summary live, right inside Excel, ask for step-by-step instructions: explain step by step how to build a pivot table from this data in Excel, where to click. The AI spells it out button by button, like for a beginner: select the range, insert a pivot, drag the category field into rows and the amount into values. You follow along and get a pivot that recalculates itself when the data changes.
The first approach is faster for a one-off report. The second is handier when the table lives and updates every week. Keep both in mind and grab whichever fits the situation.
Section 07Charts: turn a table into a diagram
Numbers in a table are weak at convincing; a picture shows at a glance where the growth is and where the drop is. Charts through AI are built as easily as reports.
The quickest route is Claude with Artifacts. You attach the data and write: build a bar chart of revenue by month. A live chart of your numbers appears on the right side of the window, and you can save it as an image and drop it into a deck or a client report. No separate service needed.
If you are not sure which chart fits, ask the AI for advice directly.
My data: revenue across 12 months and each sales channel's share.
Which chart type is best for revenue by month,
and which for the channel shares? Explain why and build both.
The AI will tell you that a trend by month reads better as a line or bars, while channel shares suit a pie chart, and it builds both right away. If you work in Excel or Google Sheets and want the chart there, ask for instructions: it will spell out which cells to select and which button to click so the chart appears in your own file.
Section 08A live breakdown: run the numbers in an hour
Let's pull it all together on an example close to anyone who sells services and courses. The task – figure out what a launch actually brings in, once costs are counted. People usually spend a week on this in a spreadsheet and still get muddled. We'll do it with AI in an hour.
You have the data: how many people bought, at what price, how much went to ads, to the team, to tools. Some of it is in your head, some in DMs. You gather everything you have, paste it into the chat, and write like a person.
Help me work out the economics of a launch. Here are the numbers:
– sold 47 seats at $250 each;
– 6 people took a payment plan and have paid $80 so far;
– ad spend was $1,600;
– the team was paid $1,200;
– tools and payment processing – about $330.
Calculate: actual revenue, full revenue including the payment plans,
total costs, net profit, and profit as a percentage of revenue.
Show the math step by step so I can check it.
The AI lays it all out: actual revenue, expected revenue once the plans are paid, total costs, net profit and its share. And it shows the math step by step, so you can see where every number came from. From there you can dig deeper – ask what it cost to acquire one client, at what ad price the launch would have gone into the red, what happens to profit if you raise the price by fifty dollars. Each of those questions is another couple of minutes, not another evening in a spreadsheet.
AI: Ad spend was $1,600 and you had 47 paying clients. So acquiring one cost about $34. At an average order of $250 that's a healthy ratio: ads eat around 14 percent of the seat price.
That's the power. You aren't doing the math – you're talking about your money and getting answers. I showed a similar breakdown, only for client calls and chats, in the piece on analyzing sales calls with AI – same principle, but about selling.

Section 09Common mistakes and how to get around them
AI is a powerful helper in spreadsheets, but it has weak spots. Knowing them matters more than knowing formulas, because a quiet error in a report costs more than any hour you spent.
It sometimes lies in the math
This is the big one. The AI can confidently hand you a wrong total, especially when it's counting a large batch right in the chat. The error sounds convincing and is easy to miss. The defense is simple: on important reports, ask it to show the math step by step, check one or two rows by hand, or better, let Excel do the counting through a formula. Then the AI writes the formula and the app does the math, and the result is exact.
It doesn't see your whole file if it's huge
Very large tables, tens of thousands of rows, the AI may process incompletely or skip part of. If there's a lot of data, break it up: ask it to work through it in chunks, or fold the export into a summary first and then work with the summary. For heavy batches, a formula in Excel is more reliable than a breakdown in the chat.
It mixes up date and number formats
The date 03/05 could be March 5 or May 3 to the AI, and a number with a comma could be a decimal or a thousands separator. Always spell out the format: my dates are month/day, the decimal mark is a period. One sentence like that at the start clears up half the confusion.
No report from AI goes to a client or into the business without a check of the final numbers. Verify the grand total, recount one row, ask a control question. Those are two minutes that save you from a wrong decision worth real money.
Section 10What you should never upload to AI
Spreadsheets are often packed with personal data: names, phone numbers, amounts, addresses. Before you send them into a chat, slow down.
You should not upload IDs and passport data, full names together with phone numbers, card numbers and details, or medical information. Even if the service is trustworthy, needlessly exposing other people's personal data is a risk: it's your responsibility to your clients and under the law.
The fix is simple – anonymize. Before uploading, replace real names with Client 1, Client 2, strip out phone numbers and account numbers, and leave only what the math needs: amounts, dates, categories. The AI will happily total revenue for Client 1, and who that really is only you know. You can even ask it to prepare an anonymized template for you.
If you work with data constantly, it helps to know that on the paid tiers, Anthropic and OpenAI don't use your data to train their models. That's calmer for sensitive information than free consumer tiers. But the anonymizing rule stays the main one, for any AI, no exceptions.
Section 11Checklist: your first report
Let's fold the whole path into a short list. Run through it once on a real task, and after that you'll do it on autopilot.
Pick your AI
Need serious analytics and charts – Claude. Want to start free right now – the free tier of Claude or ChatGPT. Watching the budget on heavy number work – DeepSeek.
Hand over the data
Attach an Excel or CSV file, or paste the table as text. From Google Sheets you can export a sheet to CSV through the File menu. Anonymize any personal client data.
Describe the task in words
Say what you want to see in the end: a total, a summary, a top-client list, a chart. Specify the date and number format and which app the formula is for – Excel or Google Sheets.
Take the result
Copy the formula into a cell, or move the finished summary and chart into your file. If a formula errors out, paste the error text back into the chat and the AI fixes it.
Double-check the numbers
Verify the grand total, recount a row or two, ask it to show the math step by step. Only after the check does the report go into the business or to a client.
Section 12The whole path in a minute
Spreadsheet work no longer requires knowing formulas. You've become the client who explains the task in words, and the AI took on the whole technical side.
There are three ways: get a ready formula to paste into a cell, hand over the data for a breakdown and get a summary, or build a new table from scratch from a description. For data and charts, Claude is the strongest. ChatGPT does the same, and DeepSeek is the cheap option for the numbers. You deliver the data as a file, as text, or as a CSV export. You frame the task like a human: what to count, what to show, in what form. You specify the formula for your app, ask for reports as a summary, and build charts through Artifacts or by following instructions for Excel.
And one iron rule on top of all of it: always double-check the final numbers, and anonymize personal client data before uploading. Start with one small task today – count last month's revenue or add up your expenses. The first report takes ten minutes, and you won't want to go back to formulas by hand.
FAQFrequently asked questions
Do I need to know Excel formulas to work with spreadsheets through AI?
No. You describe the task in plain words: add up sales for each rep, work out the average order, find the duplicates. The AI either hands you a ready formula to paste into a cell or does the math right in the chat. You don't need to keep function names or syntax in your head – the AI handles that.
Which AI works best with spreadsheets?
For data analysis and reports, Claude is the strongest: it counts carefully, accepts Excel and CSV files, and draws charts right in the window with Artifacts. ChatGPT is good too, and DeepSeek is a cheap, capable option for crunching numbers – enough for simple summaries, formulas, and short reports. For heavy analytics, Claude is the safest bet.
Can I upload my own Excel file straight into the AI?
Yes. Claude and ChatGPT accept XLSX and CSV files: drag it into the chat and the AI sees every row. If a service doesn't take files, copy the table straight from Excel or Google Sheets and paste it in as text – rows and columns are preserved. From Google Sheets you can also export a sheet to CSV through the File menu.
Does the AI add up the sums and percentages, or does Excel?
It can be either. On a small table, the AI will total sums, averages, and percentages right in its answer. On a big batch it's safer to ask it for a ready formula and paste that into the sheet – then Excel does the math and the result recalculates automatically when numbers change. Double-check the total either way.
How do I move a formula from the AI into my own spreadsheet?
Copy the formula from the answer, click the cell you want, and paste. Tell the AI which app the formula is for – between Excel and Google Sheets some function behavior and the argument separators differ depending on your regional settings. Ask for the version for your app and it drops in without edits.
Is it safe to upload client data into an AI?
IDs and passport data, full names with phone numbers, card details, and medical information should never go into a chat. Anonymize before uploading: replace names with Client 1, Client 2 and strip out phone and account numbers. On paid tiers, Anthropic and OpenAI don't train on your data, but the anonymizing rule holds for every service.
Can the AI make a mistake in the math?
Yes. AI sometimes returns a confident-sounding but wrong number – that's called a hallucination. So verify the final sums: ask it to show the math step by step, check one or two rows by hand, or let Excel do the counting through a formula. For important reports this is a required step, and it takes a couple of minutes.
Can the AI build charts from a table?
Yes. Claude draws a chart right in the chat window with Artifacts – bars, lines, a pie chart of your data. You can also ask it to suggest which chart type fits the task and get step-by-step instructions for building it in Excel or Google Sheets in a few clicks.